Dear Fellow Investor:
After a strong bull run for risk assets into the end of Q1 2024, higher than expected inflation in the backdrop of a strong U.S. economy, has put the Federal Reserve’s path to interest rate reductions into question.
The Federal Reserve (the “Fed”) already reduced their outlook for rate cuts from four to three cuts in 2024 at the March FOMC meeting.1 Now, with inflation increasing 0.4% Month-over-Month in February and March, there is a real risk that the Fed will push back their rate cut timeline even further. Some analysts are even forecasting that the Fed won’t cut until March 2025 at the earliest if inflation continues to run hot and economic growth remains robust.2
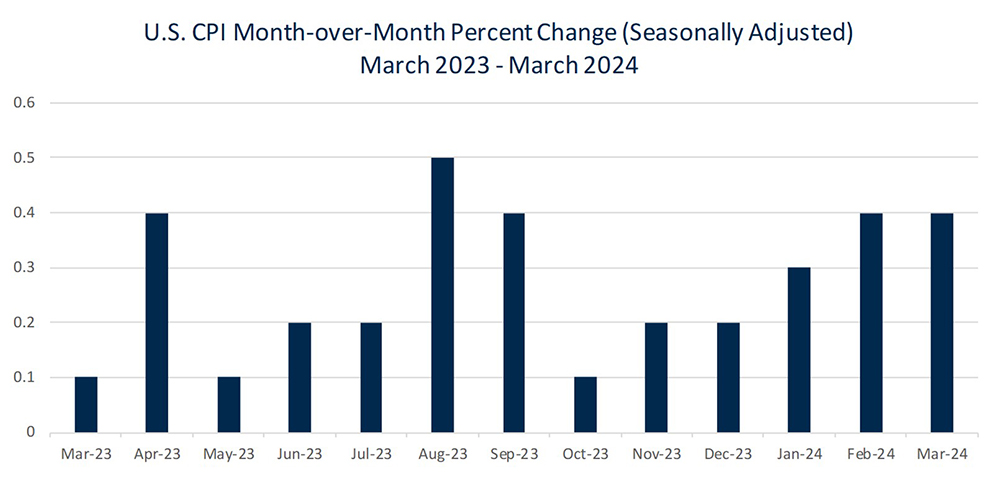
Source: U.S. Bureau of Labor Statistics3
The Bond Market has the most to lose in the Short Run
The U.S. investment-grade bond market, due to its sensitivity to interest rates, has the most to lose this year if interest rate cuts are pushed back into the end of 2024 or 2025. Upward rate pressures will see new issues continue to demand higher rates, resulting in price declines of existing bonds yielding less than the current yield.
The Bloomberg Aggregate Bond Index (the “Agg”) that tracks the performance of the U.S. investment-grade bond market is entirely composed of Treasury securities, mortgage-backed securities, asset-backed securities, municipals, and corporate bonds. These bonds, of course, are particularly sensitive to interest rate risk and the uncertainty of future rate cuts.
Even the top 10 largest Intermediate Core Plus Bond Funds by AUM4 that aim to provide investment-grade bond exposure with greater flexibility to invest in non-core bond sectors such as high yield, bank loans, emerging-market debt, and non-U.S. currency exposure have an average correlation of 0.96 against the Agg over the last 5 years.
Therefore, the core bond allocation of a portfolio is likely lacking diversification against interest rate risk and the expected rate volatility as the Fed grapples with ‘higher for longer’ for the rest of 2024. In contrast, BTS Managed Income and BTS Tactical Fixed Income have correlations of 0.81 and 0.64, respectively, against the Agg over the last 5 years.
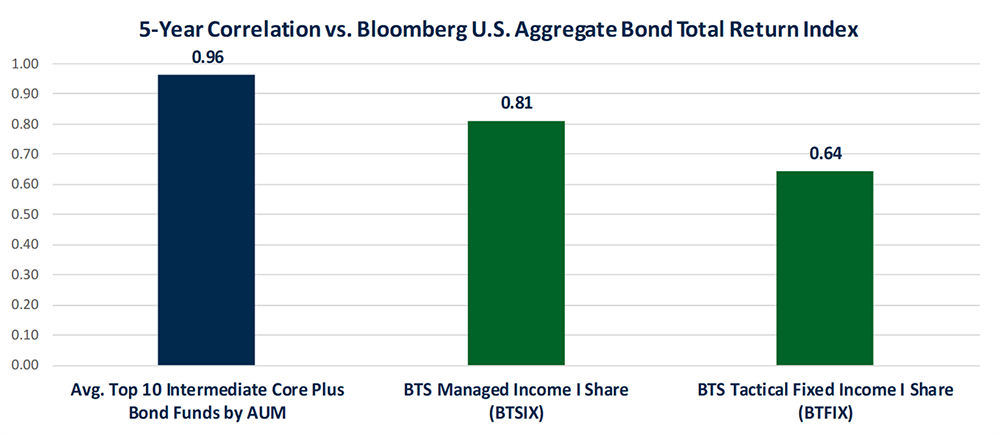
Source: Morningstar Direct (4/1/2019 - 3/31/2024 using Monthly Returns)
Higher Rates Warrant Tactical Allocations
Going into Q2 and beyond, we believe BTS Funds are poised to manage this increased interest rate risk, as well as the default risk of the bond market which is contingent on the strength of the U.S. economy. So far economic growth has remained robust, increasing at an annual rate of 4.9% in Q3 2023 and 3.4% in Q4 2023.5 However, higher interest rates will eventually affect all risk assets if held elevated for too long, especially bonds susceptible to defaults when their cash flows are squeezed by higher financing costs.
Currently, BTS is partaking in the strong relative strength of High Yield bonds against the rest of the bond market, as High Yields have not yet begun to discount a high probability of a recession and subsequent defaults. BTS will look to safety in cash if economic conditions deteriorate and price trends confirm a possible recession scenario.
Eventually, higher rates affect all aspects of the economy from borrowing to spending and could cause a mild recession. In our opinion, tactical strategies may outperform if the Fed does not act appropriately in its timing to eventually reduce interest rates.
Geopolitical Tensions
Geopolitical tensions, like in 2022 with Russia’s invasion of Ukraine, have once again sent shockwaves in financial markets as the tensions in the Middle East have put the world on high alert for conflict and its impact to global commerce and oil prices.
In the short run, there may be tactical opportunities for a flight to quality trade in U.S. treasuries lasting 2-4 weeks where treasuries outperform due to widespread market fear and panic in the context of these global ramifications. Although this risk is less likely to affect financial markets in the long run, short-term shocks could disrupt economic and market conditions resulting in tactical allocations to treasuries in BTS Funds.
BTS Managed Income
While BTS Tactical Fixed Income offers full tactical allocations with the potential to outperform during certain market conditions, BTS Managed Income offers a diversified approach to generating income. We believe this approach may offer diversification against Intermediate Core Plus Bond Funds which have a high correlation to the Agg.
Below, are some examples of risk-on, income producing asset classes that the BTS Managed Income Fund strategically allocates to in a semi-active manner to increase diversification against the Agg that seeks to increase yield and return against traditional bond investments.
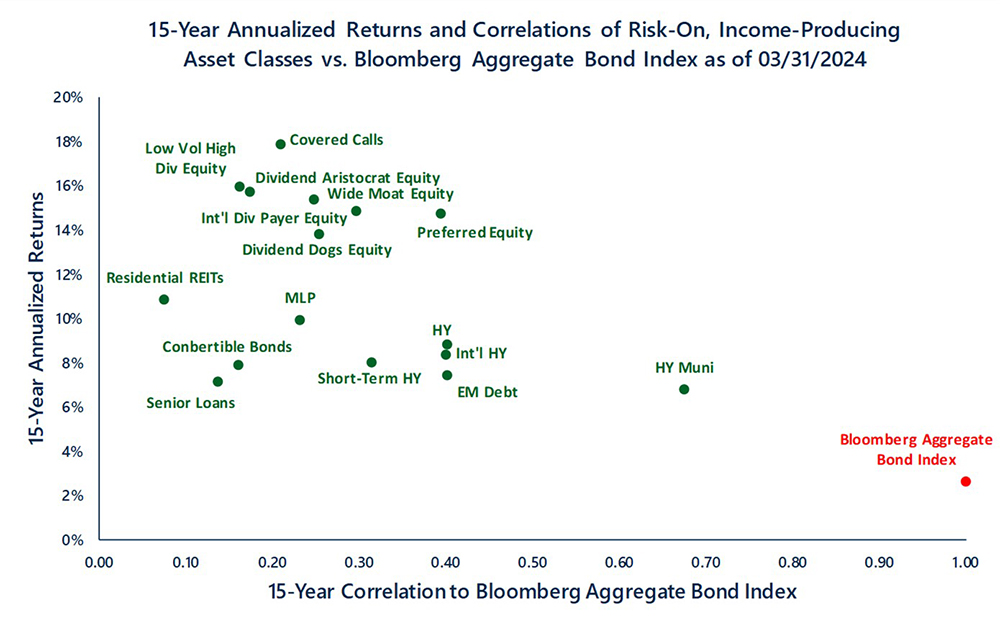
Source: Morningstar Direct
BTS Managed Income’s holistic approach to income incorporates traditional bond analysis with diversification across a larger universe of income producing asset classes, along with a 30% tactical component that follows the BTS Tactical Fixed Income strategy.
Over the past year, as interest rates remain volatile, the diversified approach has shown efficacy as BTS Managed Income (Class A) has returned 6.49% whereas the Bloomberg US Aggregate Bond Index has returned 2.37%.
BTS Managed Income Returns as of 03/31/2024
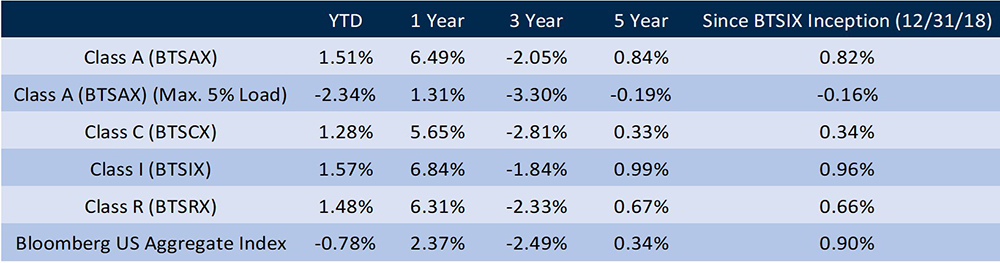
The performance data quoted here represents past performance. Current performance may be lower or higher than the performance quoted above. Investment return and principal value will fluctuate, so that the shares, when redeemed may be worth more or less than their original cost. Past performance is no guarantee of future results. A Fund’s performance, especially for very short periods of time, should not be the sole factor in making your investment decision. For performance information current to the most recent month-end, please call toll-free 1-877-287-9820.
Total Annual Operating Expenses:
Class A: 2.43%; Class C: 3.18%; Class I: 2.18%; Class R: 2.68%
Total Annual Operating Expenses After Fee Waiver and/or Expense Reimbursement:
Class A: 2.11%; Class C: 2.86%; Class I: 1.86%; Class R: 2.36%
The Advisor has contractually agreed to waive fees and to make payments to limit fund expenses, until at least April 30th 2024, so that the total annual operating expenses (exclusive of certain fees or expenses) do not exceed 1.75%, 2.50%, 1.50%, and 2.00% of average daily net assets attributable to Class A, Class C, Class I , and Class R shares respectively.
BTS Enhanced Equity Income
With increased demand for uncorrelated income producing asset classes, BTS has spent the last few years developing an equity strategy focused on income using rule-based fundamental analysis. BTS Enhanced Equity Income consists of 40% of BTS Dividend Aristocrats, 30% of BTS Equity Fortress, 20% BTS Highest Yielding Equity, and 10% Covered Call ETFs.
BTS Dividend Aristocrats are stocks that have increased their dividend for many consecutive years, potentially offering stable income during the next recession if interest rates stay volatile. BTS Equity Fortress stocks are those with strong internal growth rates with an ability to finance growth without taking on excess debt, a crucial advantage when cash flows are squeezed by declining consumer spending in recessionary and high interest rate environments. Highest Yielding Equity are those stocks with the highest dividend yields in their sectors. Although an investor needs to be careful about ‘falling knives’ or those stocks with an artificially inflated yield due to price declines, these stocks can boost income or total returns through dividend reinvestment. Covered Call ETFs offer supplemental monthly income by writing calls on S&P 500 and NASDAQ 100 strategies.
BTS ‘enhances’ these concepts by running quarterly rules-based fundamental analysis with value overlays. BTS expands the universe of securities to include the large 1500 U.S. equities by market capitalization and considers stocks from all sectors, overweighting sectors with the strongest outperformance against their historical averages.
During periods of heightened interest rate volatility, diversifying income sources into qualified dividends and covered call strategies offers another layer of diversification in an income-centric portfolio.
Conclusion
As markets continue to grapple with interest rate volatility this year, tactical and diversified fixed income solutions offer uncorrelated return streams and diversified income sources compared against the typical bond allocation of a portfolio.
In our opinion, BTS Managed Income offers an opportunity to participate in bond market returns while supplementing income with diversified sources that have historically outperformed the Agg over the last 15 years.
We at BTS remain committed to adapting to ever-changing market and economic conditions in order to best serve our clients. We thank you for the opportunity to manage your assets.
Sincerely,
Vilis Pasts
Matthew Pasts, CMT
Isaac Braley
Co-Portfolio Managers
The material provided herein has been provided by BTS Asset Management and is for informational purposes only. BTS Asset Management serves as investment advisor to one or more mutual funds distributed through Northern Lights Distributors, LLC member FINRA/SIPC. Northern Lights Distributors, LLC and BTS Asset Management are not affiliated entities.
It should not be assumed that investment decisions made in the future will be profitable or guard against losses, as no strategy can guarantee future results or entirely protect against loss of principal. There is no guarantee that the strategies discussed herein will succeed in all market conditions or are appropriate for every investor.
Investors should carefully consider the investment objectives, risks, charges, and expenses of the BTS Tactical Fixed Income Fund and the BTS Managed Income Fund before investing. This and other information about the Fund is contained in the prospectus and should be read carefully before investing. The prospectus can be obtained on our web site, www.btsfunds.com, by calling toll free 1‐877‐287‐9820 (1‐877‐BTS‐9820), or by calling your financial representative. The BTS Tactical Fixed Income Fund is distributed by Northern Lights Distributors, LLC, Member FINRA/SIPC. BTS Asset Management, Inc. is not affiliated with Northern Lights Distributors, LLC.
CITATIONS
1Fed sees three rate cuts in 2024 but a more shallow easing path.
2Wall Street pushes out rate-cut expectations, sees risks they don't start until March 2025.
3Consumer Price Index for All Urban Consumers
4The top 10 largest Intermediate Core Plus Bond Funds used are Strategic Advisers Fidelity Core Inc (FIWGX), Dodge & Cox Income I (DODIX), Strategic Advisers Core Income (FPCIX), PIMCO Total Return Instl (PTTRX), Bridge Builder Core Plus Bond (BBCPX), Metropolitan West Total Return Bd I (MWTIX), Baird Core Plus Bond Inst (BCOIX), DoubleLine Total Return Bond I (DBLTX), Guggenheim Total Return Bond Instl (GIBIX), and PGIM Total Return Bond Z (PDBZX). As of 03/31/2024. Source: Morningstar.
5Bureau of Economic Analysis - Gross Domestic Product
IMPORTANT RISK INFORMATION
Investing, including investing in mutual funds, involves risk, including possible loss of principal. There is no assurance that any strategy will achieve its investment objective. The value of fixed income securities will fluctuate with changes in interest rates. Defaults by fixed income issuers could also harm performance. Lower quality bonds known as “high yield” or “junk” bonds, present greater risk than bonds of higher quality, including an increased risk of default. An economic downturn or period of rising interest rates could adversely affect the market for these bonds and reduce the Portfolio Manager’s ability to sell its bonds. The use of leverage within a strategy will indirectly cause additional expenses and could potentially magnify the gains or losses. Diversification does not ensure a profit or guarantee against loss.
The U.S. CPI Month-over-Month Percent Change (Seasonally Adjusted) is the Consumer Price Index for All Urban Consumers (CPI-U) and is a monthly measure of the average change over time in the prices paid by consumers for a market basket of consumer goods and services. The CPI-U is based on the spending patterns of urban consumers. Index data are available for the U.S. City Average (or national average), for various geographic areas (regions and metropolitan areas), for national population size classes of urban areas, and for cross-classifications of regions and size classes. Individual indexes are available for more than 200 items (e.g., apples, men's shirts, airline fares), and over 120 different combinations of items (e.g., fruits and vegetables, food at home, food and beverages, and All items).
An Intermediate-Term Core-Plus Bond Fund invests primarily in investment-grade U.S. fixed-income issues including government, corporate, and securitized debt, but generally have greater flexibility than core offerings to hold non-core sectors such as corporate high yield, bank loan, emerging-markets debt, and non-U.S. currency exposures. Their durations (a measure of interest-rate sensitivity) typically range between 75% and 125% of the three-year average of the effective duration of the Morningstar Core Bond Index.
The S&P 500 includes 500 leading companies in leading industries of the US economy and is a proxy for the total stock market.
The NASDAQ 100 includes 100-plus of the largest domestic and international non-financial companies listed on the Nasdaq Stock Market based on market capitalization.
Bloomberg Aggregate Bond Index (Bloomberg Agg Bond)- An index used by bond funds as a benchmark to measure their relative performance. The index includes government securities, mortgage-backed securities, asset-backed securities and corporate securities to simulate the universe of bonds in the market. The maturities of the bonds in the index are more than one year.
Short-Term HY is the ICE BofA 0-5 Year US High Yield Constrained Index that tracks the performance of short-term US dollar denominated below investment grade corporate debt publicly issued in the US domestic market.
Senior Loans is the Morningstar LSTA US Leveraged Loan Index and is a market-value weighted index designed to measure the performance of the US leveraged loan market.
EM Debt is the Bloomberg Emerging Markets Hard Currency Aggregate Index and is a flagship hard currency Emerging Markets debt benchmark that includes USD-denominated debt from sovereign, quasi-sovereign, and corporate EM issuers.
Int’l HY is the Bloomberg Global High Yield Index and is a multi-currency flagship measure of the global high yield debt market. The index represents the union of the US High Yield, the Pan-European High Yield, and Emerging Markets (EM) Hard Currency High Yield Indices. The high yield and emerging markets sub-components are mutually exclusive.
HY is the Bloomberg US Corporate High Yield Bond Index measuring the USD-denominated, high yield, fixed-rate corporate bond market. Securities are classified as high yield if the middle rating of Moody's, Fitch and S&P is Ba1/BB+/BB+ or below. Bonds from issuers with an emerging markets country of risk, based on Bloomberg EM country definition, are excluded.
HY Muni is the Bloomberg Municipal Bond 10 Year (8-12) TR Index Unhedged USD and covers the USD-denominated long-term tax exempt bond market. The index has four main sectors: state and local general obligation bonds, revenue bonds, insured bonds and prerefunded bonds.
Low Vol High Div Equity is the S&P 500 Low Volatility High Dividend Index and is made up of 50 stocks from S&P 500 that offer high dividend yields. The index is designed to provide exposure to high yield stocks in the US while meeting stability and diversification requirements.
Dividend Dogs Equity is the S-Network Sector Dividend Dogs Index and is a portfolio of fifty stocks derived from the S&P 500 Index. The SDOGX methodology selects the five stocks in each of the ten GICS sectors that make up the S&P 500 which offer the highest dividend yields as of the last trading day of November.
Dividend Aristocrats Equity is the S&P 500 Dividend Aristocrats index and is designed to measure the performance of S&P 500 index constituents that have followed a policy of consistently increasing dividends every year for at least 25 consecutive years.
Int’l Dividend Payer Equity is the Dow Jones Global Select Dividend and aims to represent the stock performance of 100 leading dividend-paying companies worldwide.
MLP is the Alerian MLP Infrastructure Index and is a composite of energy infrastructure Master Limited Partnerships (MLPs). The capped, float-adjusted and capitalization-weighted index is disseminated real-time on a price-return basis (AMZI) and on a total-return basis (AMZIX).
Wide Moat Equity is the Morningstar® Wide Moat Focus Index and provides exposure to companies with Morningstar® Economic Moat™ Ratings of wide that are trading at the lowest current market price/fair value ratios. Moat ratings and fair value estimates are determined through independent research conducted by the Morningstar Equity Research team.
Residential REITs is the MSCI US REIT Index and is a total-return index comprising the most actively traded real estate investment trusts. MSCI commenced calculation of the index on 6/20/05. Prior to that, AMEX began calculation with a base level of 200 from 12/30/94. Sub-industries began on 5/1/06 as the result of 2006 Annual GICS review.
Covered Calls is the CBOE S&P 500 BuyWrite Index (BXM) and is a benchmark index designed to track the performance of a hypothetical buy-write strategy on the S&P 500 Index.
Convertible Bonds is the Bloomberg US Convertibles Composite Total Return Unhedged USD.
BTS Enhanced Equity Income is BTS strategy current available at Axos Advisor Services and various UMA/SMA platforms. It consists of 4 strategies, Dividend Aristocrats, Equity Fortress, Highest Yielding Equity, and Covered Calls.
Dividend Aristocrats is a BTS strategy that breaks the S&P 1500 into its 11 GICS Sectors and then filters all securities that have 10-15 years of increasing dividends, based on which sector it is in. BTS may consider a security with less than 10 years of increasing dividends if there are less than 2 securities in any given sector with less than 10 years of increasing dividends. These securities are then run through a proprietary securities selection algorithm that is rule-based in nature and does not change. The top security is then compared against similar historical Dividend Aristocrats in its sector and a historical outperformance is calculated. The top sector is overweighted, and the bottom 2 sectors are eliminated.
Equity Fortress is a BTS strategy that breaks the S&P 1500 into its 11 GICS Sectors and then filters the top 5-10 securities in each sector based on a proprietary Equity Fortress Model that considers how well the security can finance internal revenue and asset growth without taking on excess debt. These securities are then run through a proprietary securities selection algorithm that is rule-based in nature and does not change. The top security is then compared against similar historical Equity Fortress securities in its sector and a historical outperformance is calculated. The top sector is overweighted, and the bottom 2 sectors are eliminated.
Highest Yielding Equity is a BTS strategy that breaks the S&P 1500 into its 11 GICS Sectors and then filters the top 5-10 securities in each sector based on highest Dividend Yield. These securities are then run through a proprietary securities selection algorithm that is rule-based in nature and does not change. The top security is then compared against similar historical Highest Yielding Equity securities in its sector and a historical outperformance is calculated. The top sector is overweighted, and the bottom 2 sectors are eliminated.
Covered Call refers to a financial transaction in which the investor selling call options owns an equivalent amount of the underlying security. To execute this, an investor who holds a long position in an asset then writes (sells) call options on the same asset to generate an income stream. The investor’s long position in the asset is the cover because it means the seller can deliver the shares if the buyer of the call option chooses to exercise.
Covered Call ETFs refers to exchange-traded funds that deploy Covered Call strategies. BTS uses ETFs that follow S&P 500 and NASDAQ 100 Covered Call strategies in the BTS Enhanced Equity Income portfolio.
*Index returns are for illustrative purposes only and should not be construed as BTS model performance or performance achieved by any BTS client. More specifically, any reference to index returns during isolated or defined periods in time is for reference only and is not meant to imply index returns are indicative of actual returns achieved in client portfolios. Investors cannot invest directly in an index, and index returns do not reflect management fees, custodial fees or brokerage commissions, which vary depending upon the custodian chosen.
Source: Morningstar (for index returns)
BTS Asset Management is affiliated with BTS Securities Corporation, member FINRA/SIPC. Securities are offered through BTS Securities Corporation and other FINRA member firms. Advisory services are offered through BTS Asset Management, Inc.
PAST PERFORMANCE IS NO GUARANTEE OF FUTURE RESULTS.
8114-NLD-04/25/2024
BTS-04/29/24-00065
BTS Asset Management, Inc. ("BTS") is an investment adviser registered with the SEC. BTS' website is limited to the dissemination of general information regarding BTS' investment advisory services. The information on this website is for general informational purposes only and should not be construed by any prospective or existing client of BTS as a solicitation to effect transactions in securities. In addition, the information on this website should not be construed by any prospective or existing client as personalized investment advice. BTS’ investment advice is given only within the context of its contractual agreements with each client. BTS' investment advice may only be rendered after the delivery of its Form ADV Part 2 and the execution of an agreement by the client or investor. BTS' Form ADV Part 2 describes BTS' business operations, services and fees and is available upon request. All information contained on this website is subject to change without notice. The information contained on this website may include forward looking statements which are based on BTS' current opinions, expectations and projections. BTS does not have any obligation to update or revise any forward looking statements. Actual results could differ materially from those anticipated in the forward looking statements. Past performance is no guarantee of future results.